Finance
Smart Money Management : Complete Guide
Published
37 minutes agoon
By
fatima seo
Managing money well is not simply about spending less. The Complete Guide To Smart Money Management is about understanding where your money goes, planning for future needs, controlling debt, building savings, and making informed financial decisions. A strong money-management system can help you handle everyday expenses while also preparing for emergencies and long-term goals.
The process does not require a complicated spreadsheet or a high income. It starts with a realistic picture of your income, expenses, debts, savings, and financial priorities. Official consumer-finance guidance also emphasizes budgeting, tracking spending, saving for unexpected expenses, and making informed decisions about borrowing and investing.
This guide explains practical money management strategies, common mistakes, useful financial habits, and ways to create a system that can adapt as your circumstances change.
What Is Smart Money Management?
Smart money management is the process of making deliberate decisions about earning, spending, saving, borrowing, protecting, and investing money.
Instead of treating each financial decision separately, effective money management connects them. For example, reducing unnecessary spending can create room for emergency savings. Building an emergency fund can reduce the need to use expensive credit when an unexpected bill arrives. Paying down costly debt can then free up more income for future goals.
A useful money-management system normally includes six areas:
- Income management — understanding how much money actually reaches you after taxes and deductions.
- Budgeting — assigning income to essential expenses, goals, savings, and discretionary spending.
- Saving — creating reserves for emergencies and planned purchases.
- Debt management — controlling borrowing costs and paying down debt strategically.
- Investing — putting suitable long-term money to work according to your risk and time horizon.
- Financial protection — reducing exposure to fraud, unexpected losses, and avoidable financial risks.
The right balance differs from person to person. Someone with irregular income may need a larger cash reserve than someone with highly predictable earnings. Likewise, someone carrying expensive consumer debt may have a different priority from someone who has no debt and already maintains adequate savings.
Why Smart Money Management Matters
Good financial habits provide more than a larger bank balance. They create flexibility.
A person who tracks expenses can identify where money is disappearing. Someone with emergency savings may be better positioned to handle an unexpected repair or temporary income loss without immediately turning to credit. Someone who understands investment fees and diversification can make more informed long-term decisions.
Money management also helps reveal trade-offs.
Suppose you have an additional $200 available each month. That money could go toward a high-interest debt, an emergency fund, retirement savings, education, or a planned purchase. There is no universal answer. The appropriate choice depends on interest rates, existing savings, financial obligations, tax considerations, and the timing of your goals.
That is why smart financial planning is more useful than blindly following a fixed percentage rule.
Smart Budgeting: Build a Plan Around Real Spending
Budgeting is the foundation of everyday money management. A budget shows how much money comes in and where it goes. Consumer.gov recommends starting with income, bills, and other expenses rather than relying on estimates.
Start With Take-Home Income
Use the amount you actually have available to spend rather than your gross salary.
Include reliable sources of income such as:
- Salary or wages
- Freelance income
- Business income
- Regular benefits
- Pension income
- Other predictable payments
For irregular income, consider using a conservative estimate rather than assuming your best month will repeat.
Separate Fixed and Variable Expenses
Fixed expenses are relatively predictable. Examples include rent, loan payments, insurance premiums, and some subscriptions.
Variable expenses can change from month to month. These may include groceries, transportation, entertainment, utilities, and personal purchases.
However, the distinction is not always permanent. A subscription might be fixed each month but still optional. Grocery spending is variable, but food itself is essential. A good budget therefore considers both amount and priority.
Include Irregular Expenses
One commonly overlooked budgeting problem is forgetting expenses that do not arrive every month.
Examples include:
- Annual insurance premiums
- School expenses
- Vehicle maintenance
- Gifts
- Medical costs
- Travel
- Home repairs
- Professional fees
- Seasonal purchases
CFPB guidance recommends reviewing several months of spending so that less frequent expenses are not overlooked.
A simple solution is to estimate the yearly cost and divide it by 12. If vehicle maintenance averages $600 per year, for example, setting aside approximately $50 per month creates a fund for that future expense.
Saving money is really a good decision for ups and downs of life.
A Practical Money Management Budget Structure
There is no single budgeting formula that works for everyone. A better approach is to create categories based on your circumstances.
| Category | What It Covers | Management Goal |
|---|---|---|
| Essential expenses | Housing, food, utilities, transportation | Keep sustainable |
| Debt payments | Credit cards, loans, other obligations | Reduce costly debt |
| Emergency savings | Unexpected expenses and income disruption | Build gradually |
| Financial goals | Education, home, business, travel | Save intentionally |
| Long-term investing | Retirement and wealth-building goals | Invest according to risk and time |
| Flexible spending | Entertainment, hobbies, dining | Keep within a defined limit |
The advantage of this approach is flexibility. If housing costs are unusually high, your discretionary spending may need to be lower. If your income increases, you can direct some of the additional money toward savings or debt rather than automatically increasing lifestyle expenses.
Smart Saving Strategies for Financial Security
Saving is easier when you give each portion of your savings a purpose.
Instead of keeping one large, undefined savings balance, consider separating goals such as:
- Emergency reserve
- Short-term purchases
- Annual expenses
- Education
- Home or vehicle goals
- Retirement
This structure makes it easier to decide when money can be spent.
Build an Emergency Fund
An emergency fund is money reserved for unexpected expenses or financial disruptions. CFPB guidance lists examples such as vehicle repairs, medical expenses, damaged appliances, and loss of income.
The amount you need depends on your circumstances. Someone with stable employment, low fixed expenses, and strong insurance coverage may have different needs from a freelancer with variable income and significant household obligations.
Some financial institutions and educators use several months of living expenses as a target. FDIC consumer guidance, for example, discusses an emergency fund covering at least six months of living expenses.
That does not mean everyone must immediately save six months of expenses. If you currently have nothing saved, a smaller initial target can be more realistic.
Automate Your Savings
Automation can remove the need to make the same decision every payday.
You can arrange an automatic transfer from a transaction account to a savings or investment account. FDIC guidance notes that regular automated transfers can help people build savings over time.
Even small contributions can become meaningful when maintained consistently.
Keep Emergency Money Accessible
Emergency savings generally need to be safe and accessible rather than exposed to large investment-market fluctuations.
The CFPB recommends considering safety, accessibility, and the temptation to spend when deciding where to keep emergency savings.
The specific account and deposit-protection rules depend on your country and financial institution, so local regulations should be checked before choosing an account.
Smart Debt Management: Reduce the Cost of Borrowing
Debt is not automatically bad. A loan can finance education, a home, a business, or another productive purpose. The problem arises when borrowing becomes expensive, excessive, or difficult to repay.
Smart debt management starts by understanding:
- Total balance
- Interest rate
- Minimum payment
- Fees
- Repayment period
- Whether the rate can change
- Consequences of missed payments
Prioritize Expensive Debt
High-interest revolving debt can grow quickly when balances remain unpaid. Paying more than the minimum can reduce the amount of interest paid over time.
Two common repayment approaches are:
Debt avalanche: Pay minimums on all debts while directing additional money toward the debt with the highest interest rate.
Debt snowball: Pay minimums on all debts while directing additional money toward the smallest balance first.
The avalanche method can reduce interest costs more efficiently when the interest rates differ significantly. The snowball method may provide quicker psychological progress because smaller balances disappear sooner.
Neither method is automatically right for every household.
Avoid Creating New Debt While Paying Old Debt
Paying down a credit card while continuing to add new purchases to the same balance can make progress difficult to measure.
A stronger approach is to identify the reason the debt accumulated. If irregular medical bills caused the problem, insurance and emergency savings may deserve attention. If recurring overspending caused it, the budget needs adjustment.
For people struggling with debt repayment, nonprofit credit counseling organizations may provide budgeting and debt-management assistance.
Smart Money Management and Credit
Credit can affect borrowing costs, housing applications, insurance arrangements, and other financial decisions depending on the country and system involved.
Good credit habits generally include:
- Paying obligations on time
- Keeping borrowing manageable
- Reviewing statements
- Checking credit information where available
- Correcting inaccurate information
- Avoiding unnecessary applications for credit
- Understanding the terms before borrowing
A credit score should not become the only measure of financial health. Someone can have a good credit score while carrying excessive debt. Conversely, someone with limited credit history may have little debt but not yet have a strong score.
The broader objective is sustainable financial health.
Investing as Part of Long-Term Money Management
Investing becomes more relevant after basic cash-flow management and financial resilience are established, although the correct sequence varies.
Money needed soon generally requires a different strategy from money intended for a long-term goal.
Before investing, consider:
- Investment time horizon
- Risk tolerance
- Liquidity needs
- Diversification
- Fees
- Taxes
- Account rules
- Investment objectives
Investor.gov explains that diversification involves spreading money among investments with different risk and return characteristics. It can reduce portfolio risk, although it cannot eliminate investment losses.
Understand Investment Fees
Investment fees deserve more attention than they often receive.
A seemingly small annual fee can reduce long-term returns because the money paid in fees is no longer available to compound. Investor.gov specifically warns that investment costs can have a significant effect on portfolio results over time.
Therefore, when comparing investments, look beyond headline performance. Consider the total cost, liquidity, risk, and whether the product actually fits your objectives.
Avoid Chasing Guaranteed Returns
There is no legitimate investment that combines high guaranteed returns with no meaningful risk.
The SEC identifies promises of high returns with little or no risk as a major fraud warning sign.
Be especially cautious when an opportunity arrives through unsolicited social-media messages, private groups, messaging apps, or pressure-based sales tactics.
Protect Your Money From Financial Scams
Financial security is not only about earning, saving, and investing. Protecting your existing money is equally important.
Common warning signs include:
- Guaranteed high returns
- Pressure to act immediately
- Requests for unusual payment methods
- Fake testimonials
- Unverified investment professionals
- Claims of secret or exclusive opportunities
- Requests to pay additional money to withdraw supposed profits
The SEC’s current investor guidance also warns about impersonation scams and investment fraud promoted through online platforms.
Before transferring money, independently verify the company, professional, investment product, and payment instructions.
Do not rely solely on a screenshot, social-media profile, website, or message supplied by the person asking for money.
Financial Goals Make Money Management Easier
A budget tells your money where to go today. Financial goals determine where you want that money to take you.
Useful goals should include:
A target: What are you trying to achieve?
A cost: How much will it require?
A deadline: When do you need it?
A contribution: How much should you set aside regularly?
For example, a $2,400 goal over 12 months requires an average of $200 per month before considering interest or investment returns.
This approach transforms an abstract goal into a measurable financial task.
Separate Short-, Medium-, and Long-Term Goals
Short-term goals might include an emergency reserve or an upcoming purchase.
Medium-term goals could include education, a vehicle, or a business project.
Long-term goals often include retirement or long-term wealth accumulation.
The time horizon matters because money needed soon generally should not be exposed to the same level of investment risk as money that will not be needed for decades.
Common Money Management Mistakes
Even people who earn well can experience financial problems. Income alone does not guarantee effective money management.
Lifestyle Inflation
When income rises, spending often rises too. Increasing expenses is not necessarily wrong, but automatically converting every raise into higher recurring costs can reduce future financial flexibility.
A better approach is to divide additional income between current enjoyment and future goals.
Ignoring Small Recurring Costs
One inexpensive subscription may not matter. Several recurring charges can become significant.
Review subscriptions and memberships periodically. Cancel services you no longer use rather than trying to eliminate every small pleasure from your budget.
Treating Irregular Income Like Regular Income
Freelancers, business owners, commission-based workers, and seasonal employees may experience large changes in monthly income.
A strong system can use conservative income assumptions and maintain a larger cash buffer when earnings fluctuate.
Investing Emergency Money
An emergency reserve has a different purpose from a long-term investment portfolio.
If an emergency occurs during a market downturn, selling investments to pay an urgent bill can lock in losses. Keeping appropriate liquid reserves can reduce that risk.
Smart Money Management for Different Income Levels
Smart money management is not reserved for high earners.
Lower or Irregular Income
Focus first on cash-flow visibility, essential expenses, high-priority bills, and a small emergency reserve.
Even a modest savings buffer can provide protection against some unexpected costs. CFPB guidance emphasizes that small amounts can still provide financial security, particularly for people who struggle to save.
Middle Income
The focus can shift toward balancing lifestyle spending with debt reduction, emergency savings, insurance, and long-term goals.
This is often the stage where lifestyle inflation becomes particularly important.
Higher Income
Higher earnings create more options but can also create more complicated financial decisions.
Tax planning, investment diversification, insurance, estate planning, business structures, and concentrated investments may require professional guidance.
A higher income does not make poor financial decisions harmless.
Lesser-Known Money Management Lessons That Matter
Some of the most useful financial lessons are easy to overlook.
Cash Flow Can Matter More Than Monthly Income
Two people can earn the same annual income but have completely different financial experiences because their bills arrive at different times.
CFPB guidance specifically highlights cash-flow timing as an important part of managing money.
Someone who receives irregular payments may need to manage the timing of transfers and bills carefully, even when annual income looks healthy.
Emergency Funds Should Have Rules
An emergency fund works better when you define what qualifies as an emergency.
A broken essential appliance might qualify. A spontaneous vacation usually does not.
However, rules should not be so strict that you refuse to use the fund for a genuine financial shock. CFPB guidance recommends setting personal guidelines while also recognizing that the fund exists to be used when needed.
Financial Systems Should Be Reviewed
A budget created five years ago may no longer fit your life.
Income, rent, family responsibilities, insurance, debt, goals, and prices can all change. Review your system after major life events and at regular intervals.
A Simple Monthly Money Management Routine
A practical routine can make financial organization easier.
At the beginning of the month: Review expected income and major expenses.
During the month: Track spending and watch for unusual charges.
On payday: Move planned savings and investment contributions before discretionary spending.
Before bill due dates: Check balances and upcoming obligations.
At the end of the month: Compare actual spending with the budget.
Every few months: Review subscriptions, insurance, debt progress, savings goals, and investment costs.
After major life changes: Rebuild the financial plan instead of simply continuing the old one.
This routine does not need to take hours. The goal is consistency.
Frequently Asked Questions About Smart Money Management
What is the best first step in money management?
The best starting point is understanding your actual cash flow. List your take-home income, recurring bills, variable expenses, debt payments, and current savings. Once you know where your money is going, you can identify which expenses need adjustment and how much you can realistically allocate toward savings or debt.
How much should I save for emergencies?
There is no universal emergency-fund amount. Your target depends on income stability, essential expenses, debt, insurance, family responsibilities, and access to other resources. Some financial guidance uses several months of living expenses as a benchmark, while people starting from zero may benefit from building a smaller reserve first and increasing it gradually.
Should I save or pay off debt first?
The answer depends on the type of debt and your financial position. High-interest debt can be expensive, but having no emergency savings can also force you to borrow when an unexpected expense occurs. A practical strategy may involve building a basic emergency reserve while aggressively addressing costly debt.
Is budgeting necessary if I earn a high income?
Yes. A high income can provide greater flexibility, but it does not automatically prevent overspending or poor financial decisions. A budget helps high earners understand recurring expenses, lifestyle inflation, taxes, debt, savings, investment contributions, and long-term financial commitments.
How can I start investing with a small amount?
Start by learning about investment risk, fees, diversification, liquidity, and your time horizon. The amount matters less than understanding what you are buying and why. Avoid investments that promise unusually high guaranteed returns, especially when the opportunity comes from an unsolicited source.
Should emergency savings be invested?
Emergency savings generally need to be available when an unexpected expense occurs. Because investment values can fall, keeping essential emergency reserves in an appropriate liquid savings vehicle may be more suitable than exposing that money to significant market risk. The right account depends on your country, banking system, access needs, and financial circumstances.
How often should I review my budget?
Review spending monthly and conduct a broader financial review every few months. You should also update your plan after major changes such as a new job, significant income change, marriage, divorce, moving, new child, major debt, or large purchase. A budget should reflect your current life rather than an outdated financial situation.
Final Thoughts on the Complete Guide To Smart Money Management
The Complete Guide To Smart Money Management comes down to a few connected principles: understand your cash flow, build a realistic budget, save for unexpected expenses, manage debt carefully, invest according to your goals and risk tolerance, and protect your money from fraud.
There is no perfect financial formula that applies to every household. The strongest approach is one that fits your income, obligations, location, goals, and risk level.
Start with visibility rather than perfection. Once you know where your money is going, you can make better decisions about where it should go next. Over time, consistent budgeting, saving, responsible borrowing, and informed investing can create greater financial flexibility and resilience.
Financial disclaimer: This article is for general educational purposes and is not personalized financial, investment, tax, or legal advice. Financial rules, taxes, deposit protection, investment products, and consumer protections vary by country. Consider consulting a qualified professional before making major financial decisions.
You may like
Business
Financial Literacy Worksheets: Money Management Basics
Published
13 minutes agoon
August 15, 2026By
fatima seo
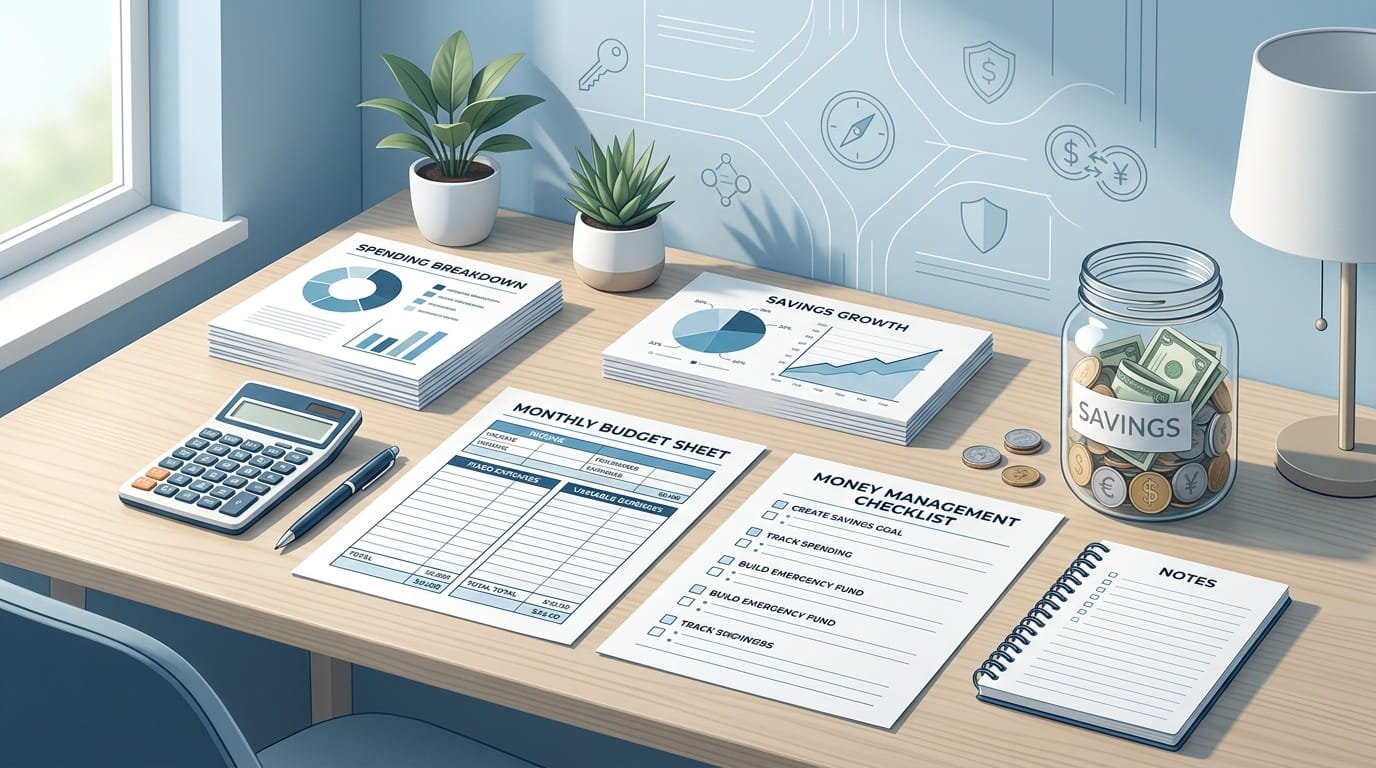
Financial Literacy Worksheets: Money Management Basics can turn abstract financial concepts into practical exercises that people can complete, review, and apply to everyday decisions. Instead of simply reading about budgeting, saving, credit, debt, or investing, learners can work through realistic examples and see how different choices affect their finances.
Financial literacy is broader than knowing how to add up expenses. The OECD describes it as a combination of financial awareness, knowledge, skills, attitudes, and behaviours needed to make sound financial decisions and improve financial well-being.
That makes worksheets particularly useful. A well-designed worksheet does not simply test whether someone knows a definition. It gives them an opportunity to practice the decision-making process.
What Are Financial Literacy Worksheets?
Financial literacy worksheets are structured learning activities that help people understand and practice personal finance concepts.
They may be designed for:
- Students learning basic money skills
- Teenagers preparing for financial independence
- College students
- Adults improving their budgeting habits
- Families teaching children about money
- Classroom financial education programs
- Community and workplace education programs
A worksheet might ask a learner to create a monthly budget, compare two borrowing options, calculate savings growth, identify needs versus wants, or build a plan for reaching a financial goal.
The strongest worksheets connect financial knowledge with an actual decision. This matters because financial literacy is not simply about memorizing financial terminology. The OECD’s financial literacy framework emphasizes applying knowledge and skills to real-life financial situations.
Why Financial Literacy Worksheets Matter
Money decisions often involve several factors at once.
For example, deciding whether to purchase a $1,000 item is not just a question of whether someone has $1,000 available. A responsible decision may require considering:
- Current income
- Existing expenses
- Savings
- Emergency needs
- Debt
- Interest costs
- Future goals
- Opportunity cost
A worksheet makes those factors visible.
Instead of saying, “Create a budget,” a worksheet can provide categories for income, housing, food, transportation, debt payments, savings, entertainment, and miscellaneous spending. The learner then has to allocate actual amounts.
That process can reveal problems that are easy to overlook when financial concepts are discussed only in theory.
The Main Types of Financial Literacy Worksheets
Different worksheets serve different learning objectives. Using several types is generally more effective than relying on one generic budgeting sheet.
1. Budgeting Worksheets
Budget worksheets help learners compare income with expenses.
A basic monthly budget might include:
| Category | Example |
|---|---|
| Monthly income | $2,500 |
| Housing | $800 |
| Food | $350 |
| Transportation | $250 |
| Utilities | $150 |
| Debt payments | $200 |
| Savings | $300 |
| Entertainment | $150 |
| Other expenses | $200 |
| Remaining amount | $100 |
The numbers above are only an illustration. Actual categories and amounts vary significantly by location, household, income, and lifestyle.
A useful worksheet should distinguish between fixed and variable expenses.
Fixed expenses generally remain relatively stable, such as a contractual rent payment.
Variable expenses can change from month to month, such as groceries, fuel, dining, and entertainment.
This distinction helps learners identify which expenses are easier to adjust when money becomes tight.
2. Needs vs. Wants Worksheets
Needs-versus-wants activities teach learners how to prioritize spending.
For example:
- Basic food → need
- Essential medication → need
- Luxury restaurant meal → want
- Basic housing → need
- Premium subscription → want
- Required transportation → need
The distinction is not always absolute. A smartphone, for example, could be a convenience for one person but an essential work tool for another.
That is why good worksheets should encourage learners to explain why they classified an expense rather than simply marking “need” or “want.”
3. Savings Goal Worksheets
Savings worksheets turn a vague goal into a measurable target.
A worksheet can ask:
- What are you saving for?
- How much does it cost?
- When do you need the money?
- How much have you already saved?
- How much can you save regularly?
- What happens if your deadline changes?
Investor.gov provides a savings goal calculator that follows a similar practical approach by helping users determine how much they need to save to reach a specific goal.
This type of exercise teaches an important lesson: financial goals become easier to manage when they are measurable.
4. Emergency Fund Worksheets
An emergency savings worksheet focuses on unexpected expenses rather than planned purchases.
Possible scenarios include:
- A vehicle repair
- A temporary loss of income
- An urgent household expense
- An unexpected travel requirement
- A major appliance replacement
The purpose is not to predict exactly what emergency will happen. It is to demonstrate why accessible savings can reduce the need to rely on expensive borrowing when something unexpected occurs.
The Consumer Financial Protection Bureau has highlighted the connection between emergency savings and the risk of relying on high-cost borrowing when unexpected expenses occur.
5. Credit and Debt Worksheets
Credit worksheets can help learners understand borrowing before they use it.
A useful activity might compare:
| Factor | Loan A | Loan B |
|---|---|---|
| Amount borrowed | $1,000 | $1,000 |
| Interest rate | 10% | 20% |
| Fees | $20 | $0 |
| Repayment period | 12 months | 12 months |
| Total cost | Calculate | Calculate |
The objective is not simply to choose the lower interest rate.
Fees, repayment periods, compounding methods, minimum payments, and other terms can affect the total cost of borrowing.
This is one reason worksheets should use complete examples rather than asking learners to compare interest rates alone.
Investor.gov also advises investors to pay attention to high-interest debt and understand how debt costs can affect financial progress.
Financial Literacy Worksheets for Students
Students can benefit from financial worksheets because many money concepts become easier to understand when connected to realistic situations.
A student worksheet might cover:
- Earning income
- Creating a budget
- Opening and managing an account
- Saving for a goal
- Understanding interest
- Comparing prices
- Using credit responsibly
- Recognizing financial scams
- Introduction to investing
- Understanding financial risk
Investor.gov offers classroom resources covering saving, investing, credit management, diversification, risk and return, quizzes, and calculators.
Its student materials also include worksheets for setting financial goals and estimating how long it may take to reach them.
Why Realistic Scenarios Work Better
A worksheet asking, “What is compound interest?” tests memory.
A worksheet asking, “You save $100 every month. How might your balance change over several years if the money earns a return?” encourages calculation and interpretation.
The second approach is closer to the real decisions people face.
The goal should be to help students understand the consequences of choices, not simply complete arithmetic problems.
Financial Literacy Worksheets for Adults
Adult learners often need worksheets that address more complicated financial situations.
Useful topics include:
- Monthly cash flow
- Household budgeting
- Debt repayment
- Emergency savings
- Insurance decisions
- Retirement planning
- Investment fees
- Financial scams
- Long-term financial goals
Adults may also need worksheets that accommodate irregular income.
Someone earning a fixed salary can create a relatively predictable monthly budget. A freelancer, contractor, seasonal worker, or small-business owner may need to work with fluctuating income.
In those cases, a useful worksheet should allow learners to enter different income levels and examine how their spending plan changes.
How to Use Financial Literacy Worksheets Effectively
Simply downloading a worksheet does not automatically improve financial knowledge.
The learning process matters.
Step 1: Identify the learning objective
Start with one specific objective.
For example:
“Understand how monthly expenses affect savings.”
That is more useful than creating a worksheet containing ten unrelated financial topics.
Step 2: Use realistic numbers
The numbers should be believable and appropriate for the learner’s situation.
A worksheet for teenagers might use part-time income and everyday purchases. An adult worksheet might include rent, utilities, transportation, insurance, debt payments, and savings.
Step 3: Require decisions
Good worksheets should ask learners to make choices.
For example:
“If your income falls by 10%, which expenses would you change first?”
That question teaches prioritization rather than simple calculation.
Step 4: Explain the result
After completing an exercise, learners should understand why their answer matters.
A budget showing a surplus, for example, can lead to a discussion about saving, debt reduction, or other financial priorities.
Step 5: Review the worksheet later
Financial circumstances change. A worksheet completed six months ago may no longer describe the person’s situation.
Investor.gov recommends regularly reviewing financial information and maintaining an ongoing approach to financial planning.
A Practical Financial Literacy Worksheet Framework
A single worksheet can combine several basic money-management skills.
Income
Record all regular sources of income.
Essential expenses
List costs that are necessary for basic living or important obligations.
Flexible spending
Record expenses that can potentially be adjusted.
Debt
List balances, interest rates, minimum payments, and due dates.
Savings
Record short-term and long-term savings goals.
Financial goals
Write down specific targets and deadlines.
Review
Calculate whether income exceeds planned expenses and determine what needs adjustment.
This structure gives learners a simple view of their financial position without requiring advanced financial software.
Budget Worksheet vs. Financial Literacy Worksheet
These terms are related but not identical.
| Feature | Budget Worksheet | Financial Literacy Worksheet |
|---|---|---|
| Main purpose | Track income and spending | Teach financial concepts and decisions |
| Typical use | Personal planning | Education and practice |
| Income tracking | Usually included | Often included |
| Expenses | Central focus | May be one topic |
| Credit | Optional | Common topic |
| Investing | Usually limited | Can be included |
| Financial concepts | Limited | Broader |
| Decision-making | Practical | Often central |
A budget worksheet is primarily a planning tool. A financial literacy worksheet is primarily an educational tool, although the two can overlap.
What Makes a Good Financial Literacy Worksheet?
Not every worksheet is equally useful.
A strong worksheet should have several characteristics.
Clear instructions
Learners should know exactly what information they need and what they are expected to calculate or decide.
Appropriate difficulty
A beginner should not be presented with complicated investment terminology before understanding basic income, spending, saving, and debt.
Practical examples
Examples should resemble real financial situations rather than unrealistic textbook problems.
Room for explanation
Questions such as “Why did you choose this option?” can reveal whether the learner understands the underlying concept.
Accurate calculations
Financial exercises should be checked carefully. An incorrect interest calculation can teach the wrong lesson.
Adaptability
The best worksheets can be adjusted for different ages, income levels, currencies, and financial systems.
Common Mistakes When Using Money Worksheets
Treating every expense as fixed
Some spending can change, while other obligations cannot be adjusted easily. A worksheet should make this difference clear.
Focusing only on cutting expenses
Financial literacy is not simply about spending less.
Income, saving, borrowing, investing, risk, and financial goals also matter.
Ignoring irregular expenses
Annual insurance payments, school expenses, vehicle maintenance, gifts, and other occasional costs can disrupt an otherwise balanced monthly budget.
A good worksheet can include an “irregular expenses” section.
Teaching rules without context
A popular budgeting rule may be useful as a starting point, but it should not be presented as a universal law.
Housing costs, healthcare, transportation, taxes, family responsibilities, and income vary widely.
Confusing saving with investing
Savings and investments serve different purposes and involve different risks.
Money needed for an upcoming expense generally should not automatically be treated the same way as money intended for a long-term investment goal.
Digital Financial Literacy Is Becoming More Important
Modern financial literacy also involves digital financial services.
People increasingly interact with money through:
- Mobile banking
- Digital wallets
- Online payment systems
- Investment apps
- Online lending platforms
- Subscription services
- Digital marketplaces
This creates additional learning requirements.
A modern worksheet can include exercises about identifying suspicious financial messages, checking whether a financial professional is properly registered, recognizing misleading investment claims, and protecting account information.
The OECD recognizes digital financial literacy as an increasingly important part of safely using digital financial services and technologies.
Investor.gov also provides resources designed to help people become more informed investors and avoid scams.
Practical Money Skills Worksheets Should Go Beyond Budgeting
One of the biggest weaknesses of basic financial education is treating budgeting as the entire subject.
A broader worksheet collection could cover five major areas:
| Financial Skill | Example Worksheet |
|---|---|
| Earning | Compare gross and net income |
| Spending | Build a monthly spending plan |
| Saving | Create a savings goal |
| Borrowing | Compare loan costs |
| Investing | Understand risk and diversification |
This approach gives learners a more complete understanding of personal finance.
Financial literacy ultimately involves applying knowledge to financial decisions, rather than simply knowing financial vocabulary.
Frequently Overlooked Details in Financial Worksheets
Some of the most useful lessons are easy to leave out.
Inflation
A worksheet can show that the same amount of money may not buy the same quantity of goods and services over time.
Opportunity cost
If someone spends money on one option, that money cannot simultaneously be used for another purpose.
Fees
Small fees can matter over long periods, particularly when associated with financial products or investments.
Investor.gov specifically provides tools that allow users to examine how investment fees and expenses can affect returns.
Risk
A worksheet about investing should not imply that higher potential returns are guaranteed.
Investment outcomes are uncertain, and risk should be part of the decision-making exercise.
Financial scams
Financial education should teach learners to question promises of unusually easy or guaranteed returns. Investor.gov explicitly advises investors to avoid opportunities that sound too good to be true.
How Teachers and Parents Can Make Worksheets More Effective
Worksheets work best when they become part of a larger discussion.
For example, after completing a budgeting exercise, a teacher could ask:
- Which expense was hardest to reduce?
- What would happen if income decreased?
- Which costs were unexpected?
- How would a major emergency affect the budget?
- What financial goal should receive priority?
Parents can use similar questions at home.
The objective is not to tell children exactly how every financial decision should be made. It is to develop the reasoning skills needed to evaluate financial choices.
The OECD’s research supports the idea that financial literacy develops over time rather than representing a single level that someone either has or does not have.
Frequently Asked Questions
What are financial literacy worksheets?
Financial literacy worksheets are educational activities that teach practical money skills such as budgeting, saving, credit, debt, investing, financial goals, and risk management. They can be used by students, teachers, parents, adults, and community education programs to practice financial decisions using realistic examples.
What should a basic financial literacy worksheet include?
A basic worksheet can include income, essential expenses, flexible spending, savings goals, debt, and a final calculation showing whether the budget balances. More advanced worksheets can add credit costs, investing, inflation, financial risk, taxes, or scam awareness.
Are financial literacy worksheets useful for students?
Yes. Worksheets can help students apply financial concepts to realistic situations instead of only memorizing definitions. Topics such as saving, budgeting, credit, investing, and financial goals can be turned into practical exercises. Investor.gov provides classroom resources and activities covering several of these areas.
Can adults use financial literacy worksheets?
Yes. Adults can use worksheets to review household cash flow, debt, savings goals, investment costs, and long-term financial plans. They can be especially useful when financial circumstances change because they provide a structured way to compare income, expenses, obligations, and goals.
What is the difference between a budget worksheet and a financial literacy worksheet?
A budget worksheet primarily helps someone organize income and expenses. A financial literacy worksheet has a broader educational purpose and can cover budgeting along with saving, borrowing, investing, risk, financial goals, and other money-management concepts.
Can worksheets teach investing?
They can introduce basic investing concepts such as risk, diversification, fees, time horizons, and the difference between saving and investing. However, an educational worksheet should not present a particular investment as guaranteed to produce a profit. Investor.gov provides educational tools covering these concepts.
How often should a personal finance worksheet be updated?
A personal budget or financial plan should be reviewed whenever income, expenses, debt, goals, or household circumstances change. Even when circumstances remain stable, periodic reviews can help identify changes in spending patterns and progress toward financial goals.
Conclusion
Financial Literacy Worksheets: Money Management Basics provide a practical way to turn financial concepts into real decision-making exercises. They can teach budgeting, saving, credit, debt, investing, financial risk, and goal setting without requiring complicated financial software.
The most effective worksheets do more than ask learners to calculate numbers. They encourage them to compare choices, recognize trade-offs, explain their reasoning, and consider how financial decisions affect future goals.
For students, worksheets can provide an early foundation for responsible money habits. For adults, they can offer a structured way to review finances and identify areas that need attention. Used consistently and updated when circumstances change, financial literacy worksheets can become a practical part of lifelong financial education.
Business
Financial Markets Images: Trading Charts & Stock Insights
Published
25 minutes agoon
August 15, 2026By
fatima seo
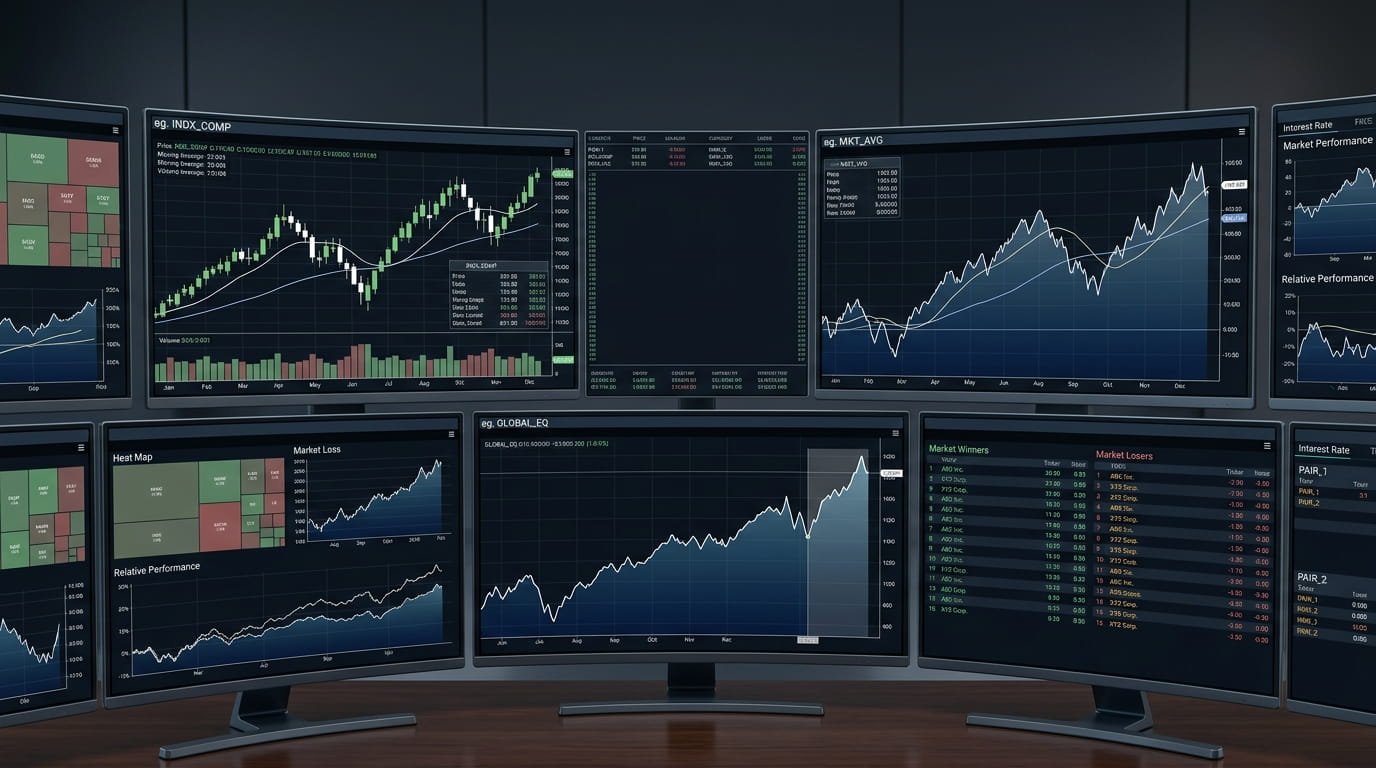
Financial Markets Images: Trading Charts & Stock Insights can make complex market information easier to understand by turning prices, volume, trends, and market activity into clear visual formats. Investors, traders, students, analysts, journalists, and finance publishers commonly use candlestick charts, line graphs, bar charts, heatmaps, and other market visuals to interpret financial data.
However, a financial chart is more than an attractive graphic. A useful image should communicate what the data represents, identify the relevant time period, and avoid creating a misleading impression about market performance. Historical stock quotes, for example, can include opening and closing prices, daily highs and lows, and trading volume.
This guide explains the main types of financial market images, how trading charts work, what different visual elements mean, how to use market graphics responsibly, and why chart images should be combined with broader financial research rather than treated as standalone predictions.
What Are Financial Markets Images?
Financial markets images are visual representations of financial information. They can include stock charts, cryptocurrency graphs, currency charts, bond-market graphics, market heatmaps, economic dashboards, trading screenshots, and educational illustrations.
The purpose depends on the audience.
For example, a trader may use a candlestick chart to study short-term price movements, while a student may use a simple line graph to understand how an index changed over several years. Similarly, a financial website may use a market heatmap to show which sectors or companies gained or lost value during a trading session.
Common examples include:
- Stock price charts
- Candlestick charts
- Line graphs
- Bar charts
- Trading-volume charts
- Market heatmaps
- Index performance graphics
- Forex charts
- Cryptocurrency charts
- Bond-market visuals
- Economic indicator charts
- Portfolio performance graphics
- Financial infographics
Because each visual serves a different purpose, choosing the right chart is essential.
Why Trading Charts Matter in Financial Analysis
Trading charts provide a visual record of market activity. Instead of reading hundreds of individual prices, a viewer can often identify broad movements from a single well-designed chart.
For instance, a stock chart may show whether prices have generally moved upward, downward, or sideways during a selected period. It can also display changes in trading volume and, depending on the chart, information about daily or intraday price ranges.
The SEC’s Investor.gov explains that stock-market information includes prices and trading activity, while the market itself operates through exchanges, over-the-counter markets, and computerized trading venues.
Charts are therefore useful for:
- Understanding historical price behavior
- Comparing securities
- Identifying trends
- Studying volatility
- Reviewing trading volume
- Presenting financial information visually
- Supporting technical analysis
- Explaining market movements to readers
At the same time, a chart should not be confused with a guaranteed forecast. Historical price patterns do not ensure that the same pattern will continue.
Types of Financial Market Charts
Different financial markets images communicate different types of information. The best choice depends on the question being answered.
Line Charts for Simple Price Trends
A line chart is one of the easiest financial visuals to understand. It usually connects a series of closing prices over time.
For example, a six-month stock chart might place dates along the horizontal axis and closing prices along the vertical axis.
Line charts work particularly well when the goal is to show:
- Long-term price direction
- Index performance
- Broad market trends
- Historical comparisons
- Simplified financial education
Because they remove some of the daily price detail, line charts are often easier for beginners than candlestick charts.
Candlestick Charts for Detailed Price Action
Candlestick charts provide more information for each trading period.
A typical candlestick can represent:
- Opening price
- Closing price
- Highest price
- Lowest price
The body represents the relationship between the opening and closing prices, while the upper and lower wicks show the trading range during that period.
Investor.gov includes candlestick charts in its investment glossary, reflecting their established role in financial-market terminology.
Candlestick charts are particularly common among active traders because they provide considerably more information than a simple closing-price line.
Still, individual candlesticks should not be interpreted in isolation. Market context, volume, time frame, liquidity, and the security itself can all affect what a chart appears to show.
Bar Charts for Price and Volume Data
Bar charts can also represent open, high, low, and close prices. Depending on the design, they may be paired with separate volume bars.
They are useful when a reader needs to compare price ranges across different periods without the visual styling associated with candlesticks.
Volume Charts
Price is only one part of market activity. Trading volume can provide additional context.
A volume chart shows the amount of a security traded during a particular period. Investor.gov’s stock-quote information identifies trading volume as part of historical market data.
For example, a large price movement accompanied by unusually high volume may tell a different story from the same price movement occurring with very little trading activity.
However, volume alone does not establish why a price changed.
Market Heatmaps
A financial heatmap displays many securities simultaneously using different sizes, labels, or shades.
A stock-market heatmap might group companies by sector and show their relative market performance. This makes it possible to identify broad areas of strength or weakness quickly.
Heatmaps are especially useful for:
- Market overviews
- Sector comparisons
- Portfolio monitoring
- Financial news graphics
- Dashboard design
The main limitation is that a heatmap sacrifices detailed information for quick comparison.
Key Elements to Look for in a Stock Chart
A professional financial chart should make its basic information easy to identify.
Price Axis
The vertical axis usually displays the price or another numerical measurement.
A misleading scale can dramatically change how a movement appears visually. Therefore, readers should always check the scale before interpreting the size of a price move.
Time Axis
The horizontal axis identifies the period covered by the chart.
A stock may appear highly volatile over one week but relatively stable over five years. The time frame therefore changes the interpretation.
Trading Volume
Volume shows how much trading activity occurred during each period.
It can add context to price changes, although it should not be treated as a standalone signal.
Moving Averages
Moving averages smooth historical price data to make longer-term trends easier to observe.
For example, a chart may display a 50-day or 200-day moving average alongside a stock price.
These indicators are widely associated with technical analysis. FINRA materials describe technical analysis as involving price and volume studies and chart-based approaches to identifying market trends.
Support and Resistance
Traders often use the terms support and resistance when discussing price levels where buying or selling activity may become significant.
These concepts can help organize a chart, but they should not be presented as guaranteed price floors or ceilings.
Financial Markets Images for Technical Analysis
Technical analysis focuses primarily on market data such as price and trading activity. It commonly uses charts and indicators to study patterns and trends.
Common technical-analysis tools include:
- Moving averages
- Trend lines
- Support and resistance
- Trading channels
- Momentum indicators
- Volume analysis
- Breakout analysis
- Overbought and oversold measures
FINRA’s materials identify technical-analysis concepts such as trend lines, support, resistance, moving averages, channels, breakouts, and consolidation among market-analysis topics.
The important distinction is that technical analysis is an analytical method, not a guarantee of future performance.
A chart can show what happened. It cannot remove uncertainty about what happens next.
Financial Charts vs Fundamental Stock Insights
One common mistake is treating a price chart as a complete picture of a company.
It is not.
A stock chart primarily shows market behavior. Fundamental analysis, by contrast, can involve financial statements, cash flow, earnings, assets, liabilities, industry conditions, and other company-specific information.
For example, two companies could have similar-looking price charts while having very different levels of debt, profitability, cash generation, or business risk.
Therefore, investors researching a company may benefit from examining both market data and fundamental information.
Comparison of Common Financial Visuals
| Visual type | Main information | Best use | Main limitation |
|---|---|---|---|
| Line chart | Closing-price trend | Simple historical overview | Limited price detail |
| Candlestick chart | Open, high, low, close | Detailed price analysis | Can be complex for beginners |
| Bar chart | Price range and values | Period-by-period comparison | Less intuitive for some readers |
| Volume chart | Trading activity | Market-activity context | Does not explain motivation |
| Heatmap | Relative performance | Market overview | Less individual detail |
| Performance chart | Return comparison | Comparing assets | Results depend on selected period |
| Financial infographic | Multiple data points | Education and publishing | Can oversimplify complex data |
How to Read a Trading Chart Correctly
A useful approach is to read the chart in layers rather than immediately searching for a prediction.
Start With the Time Frame
First, identify whether the chart covers minutes, hours, days, months, or years.
Next, check whether the selected period is appropriate for the question being asked.
A short-term trader and a long-term investor may reasonably examine the same stock using completely different time frames.
Check the Price Scale
Then examine the vertical axis.
Ask whether the chart uses a normal or unusual scale and whether the visual size of the movement accurately reflects the numerical change.
Examine Price and Volume Together
After that, compare price movements with trading volume.
A major price movement accompanied by substantial trading activity may deserve closer investigation. However, the chart still cannot establish the exact cause.
Look for Context
Finally, consider events outside the chart.
Company earnings, economic reports, interest-rate changes, industry developments, corporate announcements, and broader market conditions can influence prices.
Investor.gov similarly emphasizes that making informed investment decisions requires research rather than simply placing trades online.
How to Choose Financial Markets Images for a Website
Financial websites need visuals that are both attractive and informative.
A good image should have:
- A clear subject
- Readable labels
- Accurate numbers
- A visible time period
- Appropriate chart proportions
- High resolution
- Good contrast
- Minimal unnecessary decoration
- Clear data sources when appropriate
For an educational article, a simplified chart can be better than a crowded professional trading terminal.
For a market-analysis article, however, more detailed visuals may be appropriate.
The key is matching complexity to the reader.
Why Data Freshness Matters
One of the most overlooked issues with financial markets images is data freshness.
A screenshot showing a stock at a particular price is only accurate for the period in which that price was recorded. Market prices can change continuously during trading.
This matters especially when publishing:
- News articles
- Stock-market commentary
- Investment explainers
- Trading tutorials
- Financial reports
A static image can quickly become outdated even when the underlying article remains useful.
Therefore, publishers should clearly identify whether an image represents live, delayed, or historical data.
For example, a chart titled “Stock Price” without a date or time frame can create unnecessary confusion.
The Importance of Liquidity in Market Charts
Charts can also hide an important issue: liquidity.
Investor.gov defines liquidity in terms of how easily a security can be bought or sold without substantially affecting its price. Low-liquidity securities can be harder to sell when needed.
This is particularly relevant when looking at charts for small or thinly traded securities.
A dramatic-looking price movement does not necessarily mean a large amount of money changed hands.
Consequently, readers should consider both price movement and trading activity when evaluating a market graphic.
Common Mistakes When Using Stock Market Images
Financial graphics can become misleading when they are presented without context.
Showing a Chart Without a Time Period
A price line without dates gives readers little information about how quickly the movement occurred.
Removing the Data Source
Readers should be able to understand where important financial information came from, particularly when exact figures are presented.
Using Outdated Screenshots
An old trading screenshot may no longer represent current market conditions.
Treating Patterns as Predictions
A historical pattern does not guarantee a future result.
Using an Extreme Axis
Changing the axis scale can make a small movement look enormous or make a significant change appear insignificant.
Ignoring Corporate Actions
Stock prices can be affected by events such as stock splits, dividends, mergers, or other corporate actions. Therefore, historical charts need appropriate context before long-term comparisons are made.
Adding Too Many Indicators
A chart containing ten indicators may look sophisticated but become difficult to interpret.
In many cases, a simple chart with clearly defined information is more useful than a crowded dashboard.
Unique Insights: What Most Financial Chart Collections Miss
Many financial markets images focus on appearance rather than information quality. A more useful approach is to treat the image itself as part of the data communication process.
A Beautiful Chart Can Still Be Misleading
Design quality does not guarantee analytical quality.
A professionally designed graphic can still use an inappropriate time frame, incomplete data, or a distorted scale.
Therefore, visual polish should come after data accuracy.
Static Images Have a Built-In Limitation
A static image freezes information at one moment.
That makes it useful for educational articles, historical examples, and reports. However, it makes it unsuitable as a substitute for live market data.
This distinction is especially important for financial websites that publish evergreen content.
The Last Price Is Not Always the Execution Price
Another frequently overlooked detail involves order execution.
Investor.gov explains that a market order generally executes at or near the current bid or ask, but the last-traded price is not necessarily the price at which a market order will execute.
That means a chart showing the latest traded price should not automatically be interpreted as the exact price a trader can obtain.
A Chart Does Not Replace Investment Research
A chart can help organize information, but investment decisions require broader context.
Investors may also need to consider the security’s fundamentals, liquidity, risk, valuation, investment objective, and their own circumstances.
This is one reason financial-market visuals work best when combined with supporting explanations rather than presented as isolated signals.
How Financial Markets Images Support Financial Education
Visual learning can make complicated concepts easier to understand.
A beginner may struggle to understand the difference between opening and closing prices when reading definitions alone. A labeled candlestick, however, can show the relationship visually.
Similarly, a simple line chart can demonstrate:
- How prices change over time.
- How a trend appears visually.
- How different time periods change the interpretation.
- Why historical performance does not guarantee future results.
For financial education, clarity should take priority over visual complexity.
Using Market Images for News and Research
Financial journalists and publishers often use charts to support market stories.
For example, an article about a market decline could use:
- An index performance chart
- Sector performance graphics
- Trading-volume data
- Historical comparisons
- A timeline of major events
However, the visual should support the article rather than replace the evidence.
When a chart presents a claim about current market conditions, the publication should verify the underlying data and make the relevant date or time period clear.
FINRA also warns investors to examine longer-term price and volume trends when evaluating suspicious market activity rather than relying only on short-term movements promoted online.
Are Financial Markets Images Useful for Investors?
Yes, but their usefulness depends on how they are used.
Charts can help investors organize historical information and understand market behavior. They can also make comparisons easier and provide context for technical analysis.
However, images alone cannot determine whether an investment is suitable.
An investor should consider the broader research behind the security, including risk, liquidity, financial condition, valuation, objectives, and time horizon.
Active trading also carries additional risks. FINRA’s current guidance notes that frequent intraday trading can involve significant risk, particularly when margin is used.
Frequently Asked Questions
What are financial markets images?
Financial markets images are visual representations of market information such as stock prices, trading volume, currency movements, index performance, bond data, and cryptocurrency prices. They include line charts, candlestick charts, bar charts, heatmaps, dashboards, and financial infographics. Their purpose is to make complex market information easier to understand and compare.
Which chart is best for stock analysis?
There is no single best chart for every situation. Line charts are useful for simple historical trends, while candlestick charts provide more detailed open, high, low, and close information. Volume charts add trading-activity context. The appropriate choice depends on whether the goal is education, long-term comparison, technical analysis, or market monitoring.
What does a candlestick chart show?
A candlestick normally shows the opening, closing, highest, and lowest prices for a selected trading period. The body represents the opening-to-closing relationship, while the wicks show the high and low. The period could represent a minute, hour, day, week, or another interval depending on the chart settings.
Can stock charts predict future prices?
Stock charts cannot reliably guarantee future prices. They can help investors study historical price behavior, trends, volatility, and trading activity. Technical analysis may identify patterns or signals, but market prices are influenced by many factors, including company developments, economic conditions, investor expectations, and unexpected events.
Why is volume important on a stock chart?
Trading volume indicates how many shares or units were traded during a particular period. It can provide additional context for price movements. For example, unusually high volume may accompany significant market activity. Still, volume does not explain the reason for a price change by itself and should be considered alongside other information.
Are financial chart screenshots reliable?
A financial chart screenshot can accurately represent the data displayed at the time it was captured, but it can become outdated quickly. Users should check the chart’s date, time frame, data source, and whether prices are real-time, delayed, or historical. A static screenshot should not be treated as current market information without verification.
Can financial images be used on websites?
Financial images can be used on websites when the publisher has the appropriate rights or the image comes with a suitable license. Charts created from data may also have separate licensing considerations depending on the data provider and presentation. Publishers should check the relevant terms rather than assuming that every online financial image is free to reuse.
Do financial market images provide investment advice?
No. A chart or financial image is a representation of information, not automatically investment advice. Investors should evaluate the underlying security, risks, liquidity, financial information, objectives, and time horizon before making decisions. A visually convincing chart should never be treated as proof that an investment will rise or fall.
Conclusion
Financial Markets Images: Trading Charts & Stock Insights provide an effective way to communicate complicated financial information. Line charts simplify long-term trends, candlestick charts show detailed price action, volume charts add trading context, and heatmaps make broad market comparisons easier.
At the same time, good financial visualization requires more than attractive design. The chart should use accurate data, identify its time frame, maintain an appropriate scale, and provide enough context for readers to interpret it correctly. Historical information should not be presented as a guaranteed forecast, and static images should not be mistaken for live market data.
Used responsibly, financial charts can improve financial education, market research, journalism, and investment analysis. The strongest approach combines clear visuals with reliable data and broader research rather than relying on a single image to explain the entire market.
Finance
Personal Loan vs. Line of Credit: Which Is Better?
Published
2 weeks agoon
July 30, 2026By
fatima seo
Borrowing money has become more flexible than ever. Whether you’re planning a home renovation, paying unexpected medical bills, consolidating debt, or funding a major purchase, choosing the right financing option can save you money and reduce financial stress.
Two of the most common borrowing options are personal loans and lines of credit. While both provide access to funds, they work in very different ways. Understanding these differences is essential before signing any lending agreement.
In this guide, we’ll compare personal loans vs. lines of credit, explain how each works, highlight their advantages and disadvantages, and help you decide which option best fits your financial goals.
What Is a Personal Loan?
A personal loan is a type of installment loan where a lender provides you with a fixed amount of money upfront. You repay the loan through equal monthly payments over a specific period, usually between one and seven years.
Personal loans can be either secured or unsecured. Most borrowers choose unsecured personal loans because they don’t require collateral, although approval depends heavily on your credit score, income, and financial history.
People commonly use personal loans for:
- Debt consolidation
- Home improvement projects
- Wedding expenses
- Medical bills
- Emergency expenses
- Large purchases
One major advantage is predictability. Because the monthly payment and repayment schedule are fixed, it’s easier to budget throughout the life of the loan.
What Is a Line of Credit?
A line of credit works differently.
Instead of receiving one large payment, the lender approves you for a maximum borrowing limit. You can borrow only the amount you need, repay it, and borrow again as long as your account remains in good standing.
Think of it as a reusable source of funds.
For example, if you’re approved for a $20,000 line of credit, you might only use $5,000 initially. Later, after repaying part or all of that balance, you can borrow again without submitting a new loan application.
Lines of credit are commonly used for:
- Business expenses
- Ongoing home renovations
- Emergency funds
- Cash flow management
- Unexpected medical costs
Most lines of credit have variable interest rates, meaning your borrowing costs may increase or decrease depending on market conditions.
Personal Loan vs. Line of Credit: Key Differences
Although both financing options provide access to money, they serve different purposes.
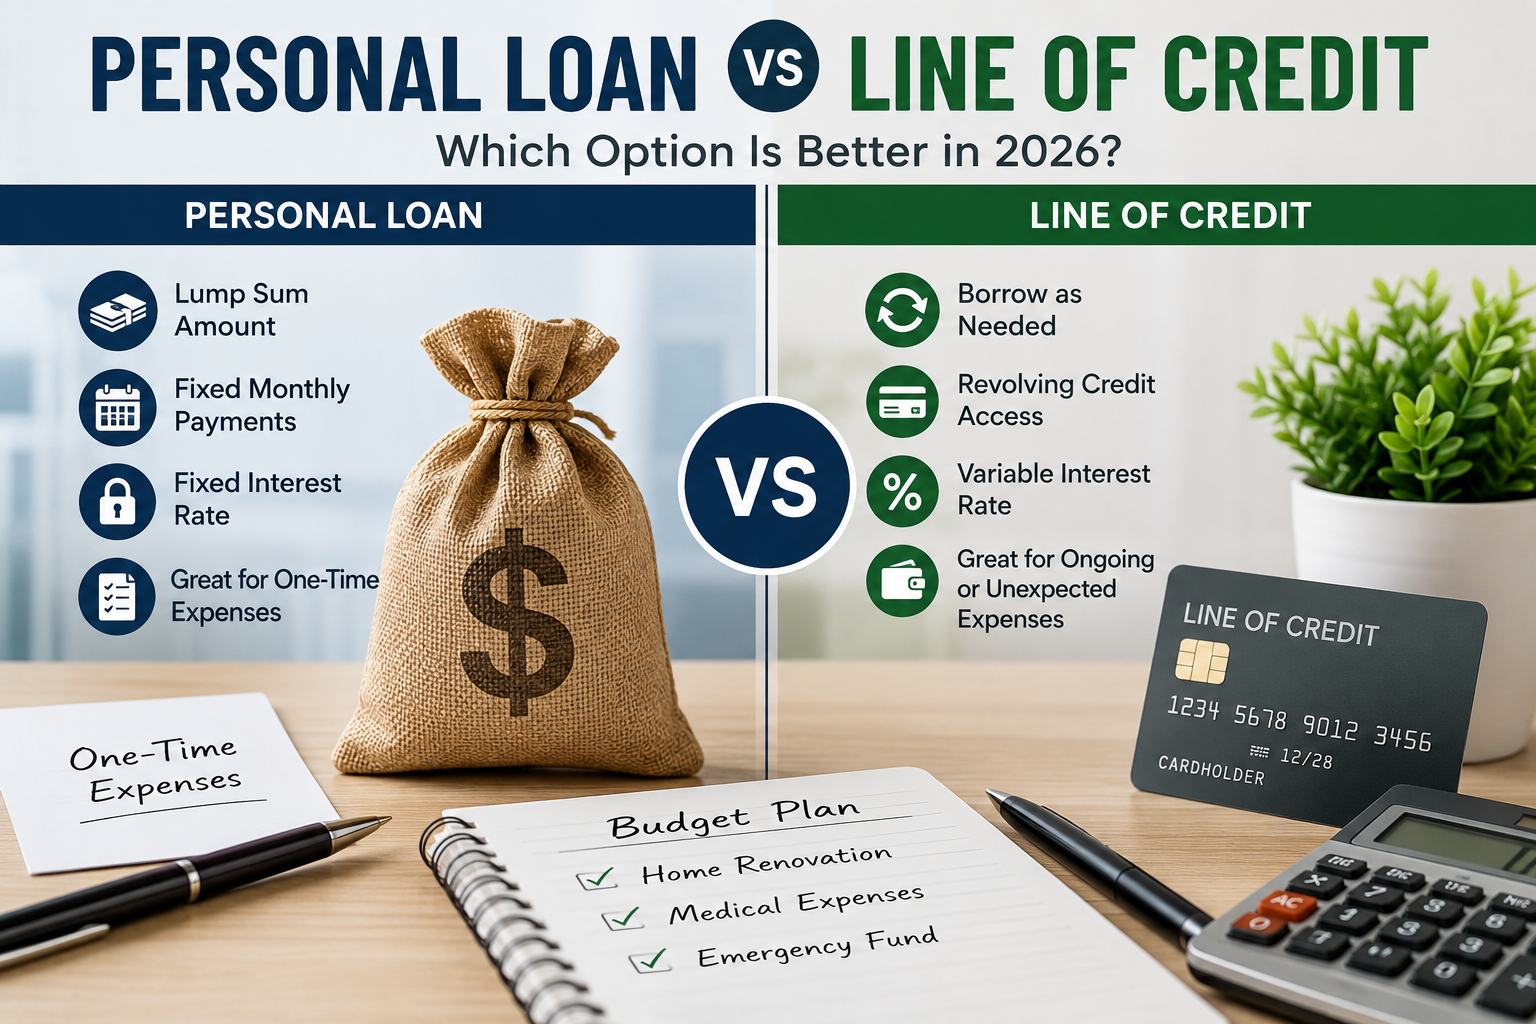
| Feature | Personal Loan | Line of Credit |
|---|---|---|
| Money Received | Lump sum | Borrow as needed |
| Interest | Usually fixed | Usually variable |
| Payments | Fixed monthly payments | Flexible payments |
| Best For | One-time expenses | Ongoing expenses |
| Reuse Funds | No | Yes |
| Budgeting | Easy | Requires discipline |
A personal loan is generally better for planned expenses with a known cost, while a line of credit offers greater flexibility when future expenses are uncertain.
Interest Rates Compared
Interest rates play a significant role in determining the total cost of borrowing.
Personal Loans
Personal loans often come with fixed interest rates. This means your monthly payment remains the same throughout the loan term, making budgeting much easier.
Borrowers with excellent credit usually qualify for the lowest available rates.
Lines of Credit
Lines of credit typically use variable interest rates tied to market benchmarks.
As interest rates rise or fall, your borrowing costs may change. While this flexibility can sometimes work in your favor, it also introduces uncertainty into your monthly payments.
If interest rates increase significantly, a line of credit could become more expensive than expected.
Repayment Terms
Understanding repayment is just as important as understanding interest rates.
Personal Loan Repayment
When you receive a personal loan, you begin repaying it immediately according to a fixed schedule.
Each monthly payment generally includes:
- Principal
- Interest
- Any applicable fees
By the end of the loan term, the balance is fully paid off.
Line of Credit Repayment
A line of credit offers greater flexibility.
You only make payments on the amount you’ve borrowed—not your total credit limit.
Many lenders require minimum monthly payments, although paying more than the minimum reduces interest costs and helps you become debt-free sooner.
Advantages of a Personal Loan
A personal loan offers several important benefits.
Predictable Payments
Fixed monthly payments make financial planning much easier.
Lower Interest for Qualified Borrowers
Applicants with strong credit often receive attractive interest rates.
Great for Large Purchases
Whether you’re renovating your home or consolidating debt, receiving one lump sum simplifies budgeting.
No Repeated Borrowing Decisions
Once approved, you receive the money immediately and follow a structured repayment schedule.
Advantages of a Line of Credit
Lines of credit provide flexibility that traditional loans cannot.
Borrow Only What You Need
There’s no need to borrow your full credit limit.
Reusable Credit
After repaying borrowed funds, you can access them again without reapplying.
Excellent for Ongoing Projects
If you’re renovating your home over several months, borrowing gradually can be far more efficient than taking one large loan.
Emergency Financial Backup
Many people keep a line of credit available for unexpected expenses without using it until absolutely necessary.
Disadvantages to Consider
Neither option is perfect.
Personal Loan Drawbacks
- Fixed borrowing amount
- Cannot reuse funds after repayment
- Possible origination fees
- Less flexibility
Line of Credit Drawbacks
- Variable interest rates
- Easier to overspend
- Requires financial discipline
- Monthly payments may fluctuate
Which Option Is Better for You?
Choosing between a personal loan and a line of credit depends on your financial situation, the purpose of borrowing, and how you plan to repay the money. While both options can provide access to funds, each serves a different purpose.
If you know exactly how much money you need and prefer predictable monthly payments, a personal loan is usually the better choice. However, if your expenses may vary over time and you want the flexibility to borrow only when needed, a line of credit may be a smarter option.
Before making a decision, consider your budget, credit score, repayment ability, and long-term financial goals.
When Should You Choose a Personal Loan?
A personal loan is generally the right choice if:
- You know the exact amount you need to borrow.
- You want fixed monthly payments.
- You are consolidating high-interest debt.
- You’re paying for a wedding, vacation, or major purchase.
- You prefer a clear repayment schedule.
For example, if you’re borrowing $15,000 to renovate your kitchen, a personal loan gives you the full amount upfront and allows you to repay it over a fixed term with consistent monthly payments.
When Should You Choose a Line of Credit?
A line of credit is a better option when your expenses are spread out over time.
It works well if you:
- Need ongoing access to funds.
- Have unpredictable expenses.
- Want to borrow only what you need.
- Need emergency financial backup.
- Own a small business with changing cash flow.
For instance, if you’re renovating your home over several months, a line of credit allows you to pay contractors and suppliers as costs arise instead of borrowing the full amount at once.
Personal Loan vs. Line of Credit: Real-Life Examples
Example 1: Home Renovation
Sarah plans to renovate her kitchen for $20,000. Since she knows the exact cost, a personal loan provides predictable monthly payments and a fixed repayment schedule.
Best Choice: Personal Loan
Example 2: Emergency Expenses
David wants financial security in case of unexpected medical bills or urgent home repairs. He may never need the money, but he wants access to it if necessary.
Best Choice: Line of Credit
Example 3: Debt Consolidation
Emily has multiple credit card balances with high interest rates. She combines them into one fixed monthly payment using a personal loan.
Best Choice: Personal Loan
Example 4: Small Business Cash Flow
A business owner occasionally needs extra funds to cover payroll or purchase inventory before customer payments arrive.
Best Choice: Line of Credit
Common Mistakes Borrowers Make
Many people choose the wrong financing option simply because they don’t understand how each product works.
Here are some common mistakes to avoid:
- Borrowing more money than necessary.
- Choosing the lowest monthly payment without considering total interest.
- Ignoring fees such as origination or annual charges.
- Making only minimum payments on a line of credit.
- Missing payment deadlines, which can damage your credit score.
- Applying for multiple loans within a short period.
Taking time to compare lenders and understand the terms can save you thousands of dollars over the life of a loan.
Tips Before Applying
Before applying for any type of financing, consider these practical tips:
- Check your credit score to understand what rates you may qualify for.
- Compare offers from multiple lenders instead of accepting the first one.
- Read all terms and conditions carefully, including fees and penalties.
- Borrow only what you genuinely need.
- Make sure your monthly payments fit comfortably within your budget.
- If possible, choose a lender with no prepayment penalties so you can pay off your balance early.
Frequently Asked Questions
Is a personal loan cheaper than a line of credit?
Not always. Personal loans often have fixed interest rates, while lines of credit usually have variable rates. The cheaper option depends on your credit profile, lender, and market interest rates.
Does a line of credit hurt your credit score?
Simply having a line of credit does not hurt your credit score. However, carrying a high balance or missing payments can negatively affect your credit.
Which option is better for debt consolidation?
A personal loan is generally the better choice because it offers fixed payments and can simplify multiple debts into one monthly payment.
Can I pay off a personal loan early?
Many lenders allow early repayment, but some may charge prepayment fees. Always review the loan agreement before signing.
Is a line of credit good for emergencies?
Yes. A line of credit can serve as a financial safety net because you only borrow money when you actually need it.
Final Verdict
There is no single financing option that works for everyone. The best choice depends on your financial needs and borrowing habits.
A personal loan is ideal if you need a fixed amount of money for a one-time expense and prefer predictable monthly payments. It offers structure, stability, and easier budgeting.
A line of credit, on the other hand, is better suited for ongoing expenses, unexpected costs, or situations where you need flexible access to funds over time. It provides convenience but also requires responsible borrowing to avoid unnecessary debt.
Before making a decision, compare interest rates, repayment terms, fees, and lender policies. Choosing the right borrowing option today can help you manage your finances more effectively and avoid costly mistakes in the future.
Financial Literacy Worksheets: Money Management Basics
Financial Markets Images: Trading Charts & Stock Insights
Smart Money Management : Complete Guide
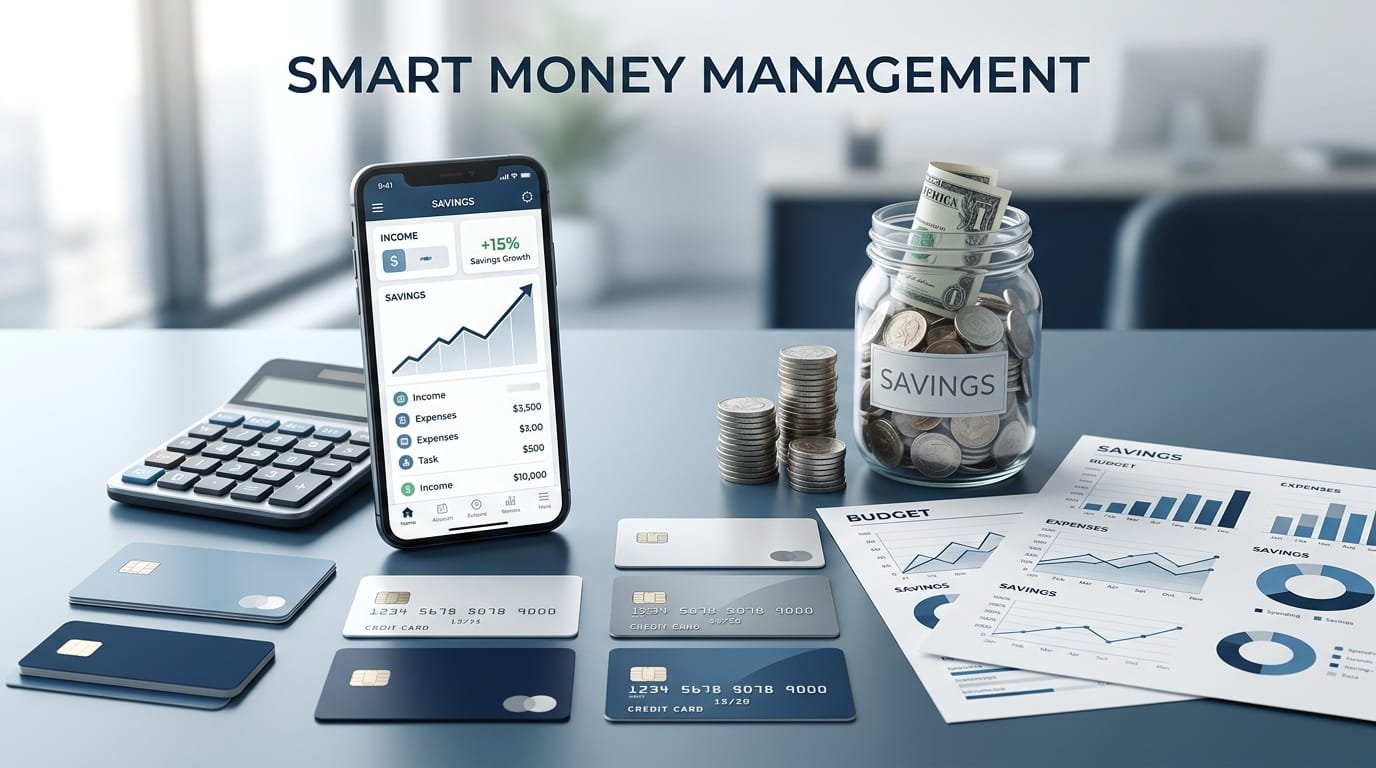
Trending
-
Entertainment9 years agoThe final 6 ‘Game of Thrones’ episodes might feel like a full season
-
Fashion9 years agoAccording to Dior Couture, this taboo fashion accessory is back
-

lifestyle6 months agoCreative Conference Room Ideas to Enhance Productivity and Collaboration in 2026
-
Entertainment9 years agoThe old and New Edition cast comes together to perform
-
Business9 years agoUber and Lyft are finally available in all of New York State
-
Business9 years agoThe 9 worst mistakes you can ever make at work
-
Entertainment9 years agoDisney’s live-action Aladdin finally finds its stars
-
Sports9 years agoSteph Curry finally got the contract he deserves from the Warriors